
Data Engineering and ML Ops Zoomcamps
Data Talks Club Zoomcamps
In 2022, I participated in two free online bootcamps (aka “zoomcamps”) for Data Engineering and ML Ops hosted by Data Talks Club. I learned a lot of practical skills that I’m putting to use daily at work. It’s allowed me to grow into my current role and take on more responsibilities related to data and data engineering.
CLICK HERE for the repo of my final project
Data Engineering Zoomcamp
Data engineering deals with building and maintaining systems for collecting, storing, organizing, and analyzing data.
I had some familiarity with tools and skills covered in the class (Python, SQL, Docker, Linux), but most of it was new to me.
A lot of modern data engineering is done on the cloud. I had no experience working in the cloud before.Getting comfortable provisioning and utilizing cloud resources might be the one of the most useful things I learned.
Topics and tools covered in the course:
- Setting up cloud infrastructure with Terraform
- Workflow orchestration with Airflow
- Data Lakes and Data Warehouses with Google Cloud Storage and BigQuery
- Analytics Engineering with dbt
- Batch Processing with Spark
- Stream Processing with Kafka (I mostly skipped this material thanks to this advice from Vicki Boykis. Of everything in the course I thought this was the least likely to be immediately useful to me. So far, I’ve been right.)
ML Ops Zoomcamp
ML Ops deals with the processes of developing, deploying, and monitoring machine learning models.
Topics covered in the course:
- Experiment tracking and model registries with MLFlow
- Model serving with Flask + Docker
- Model monitoring concepts
Final Project
CLICK HERE for the final project repo
The course materials and exercises were great for learning the concepts of Data Engineering and ML Ops, but I didn’t learn how to put them in practice until building the final project. It’s true what they say, the best way to learn is to do projects. There is just a lot that you can’t learn unless you have to figure it out on the go.
The goal of my project was to build a system to predict the hourly electrical demand for the region where I live.
I built a data pipeline to collect, store, and process the necessary data. Then I trained models to predict hourly demand and deployed the best model to a web app that compares my prediction to the EIA’s official forecast,and actual data. I also built a separate dashboard to monitor the performance of the model over time.
Data Engineering
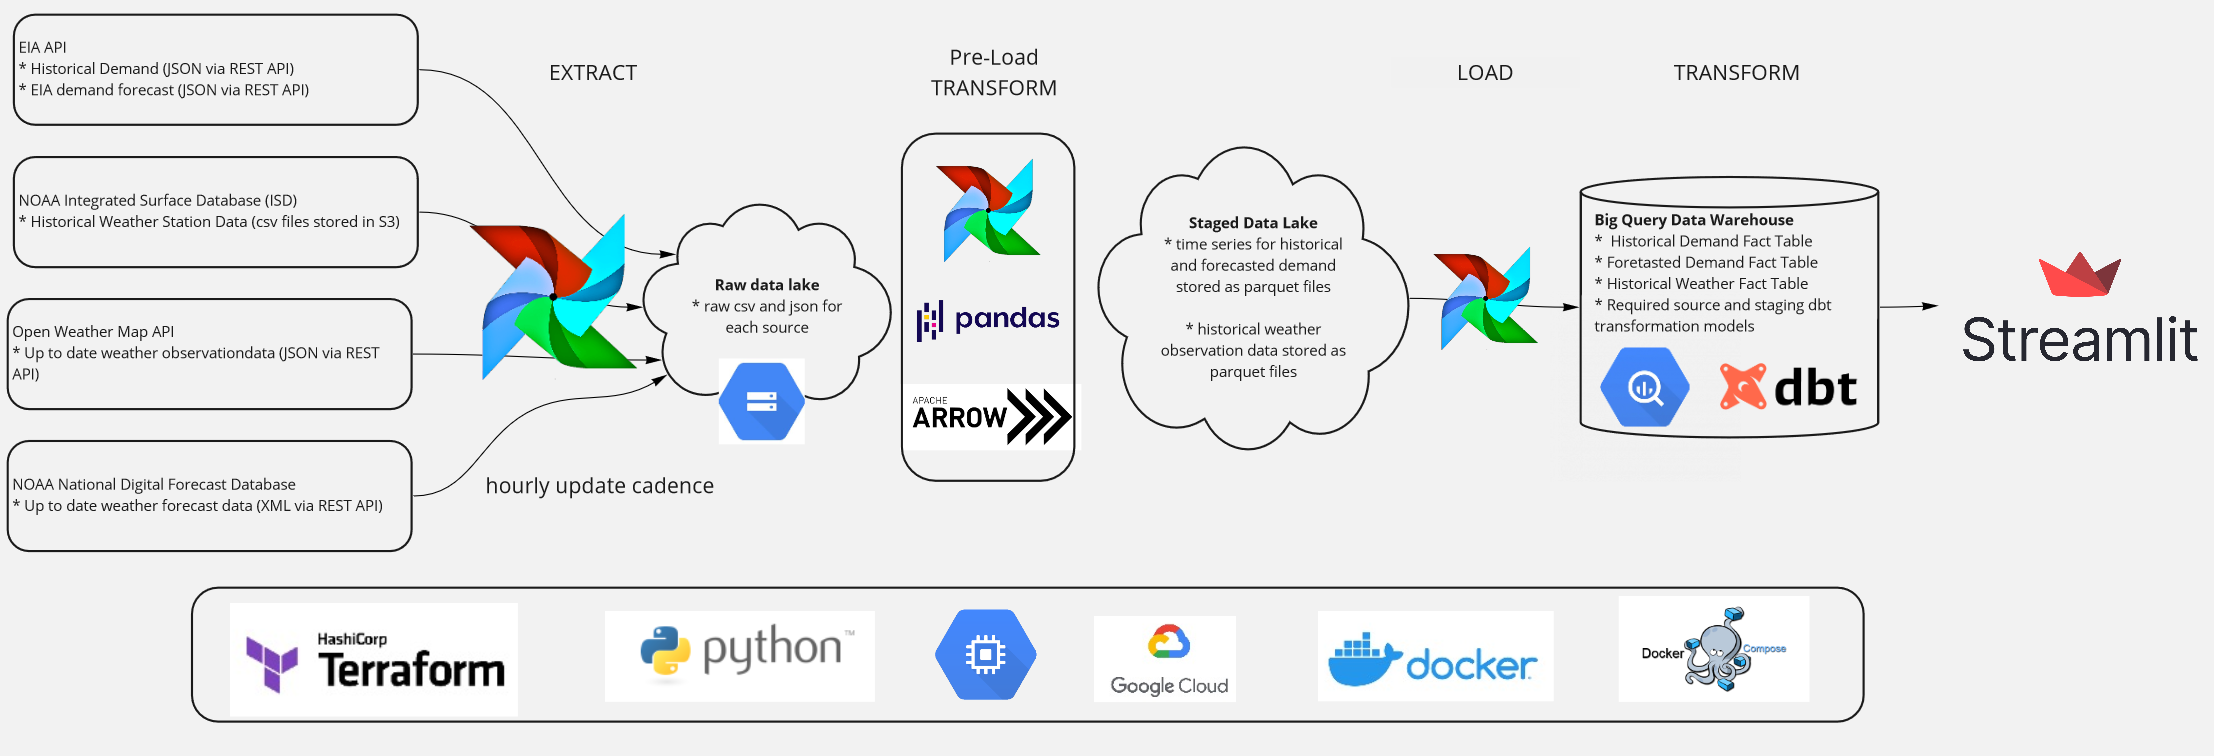
The figure above outlines the data pipeline for the project.
All of the compute infrastructure runs on Google Cloud Platform and was provisioned by Terraform.
The pipeline is orchestrated by an Airflow instance running on a Compute Engine VM. On an hourly basis, Airflow pulls the following data:
- Historical electrical demand data from the EIA REST API (JSON),
- Historical weather data from NOAA Integrated Surface Database S3 bucket (csv)
- “Real time” weather data from Open Weather Map API (JSON),
- Weather forecast data from NOAA National Digital forecast database (XML)
All of the raw data in a data lake (Google Cloud Storage) for proccessing.
The data is cleaned up and loaded into a data warehouse (BigQuery). dbt is used within the warehouse to clean the data into a data model that is ready for visualization and modeling.
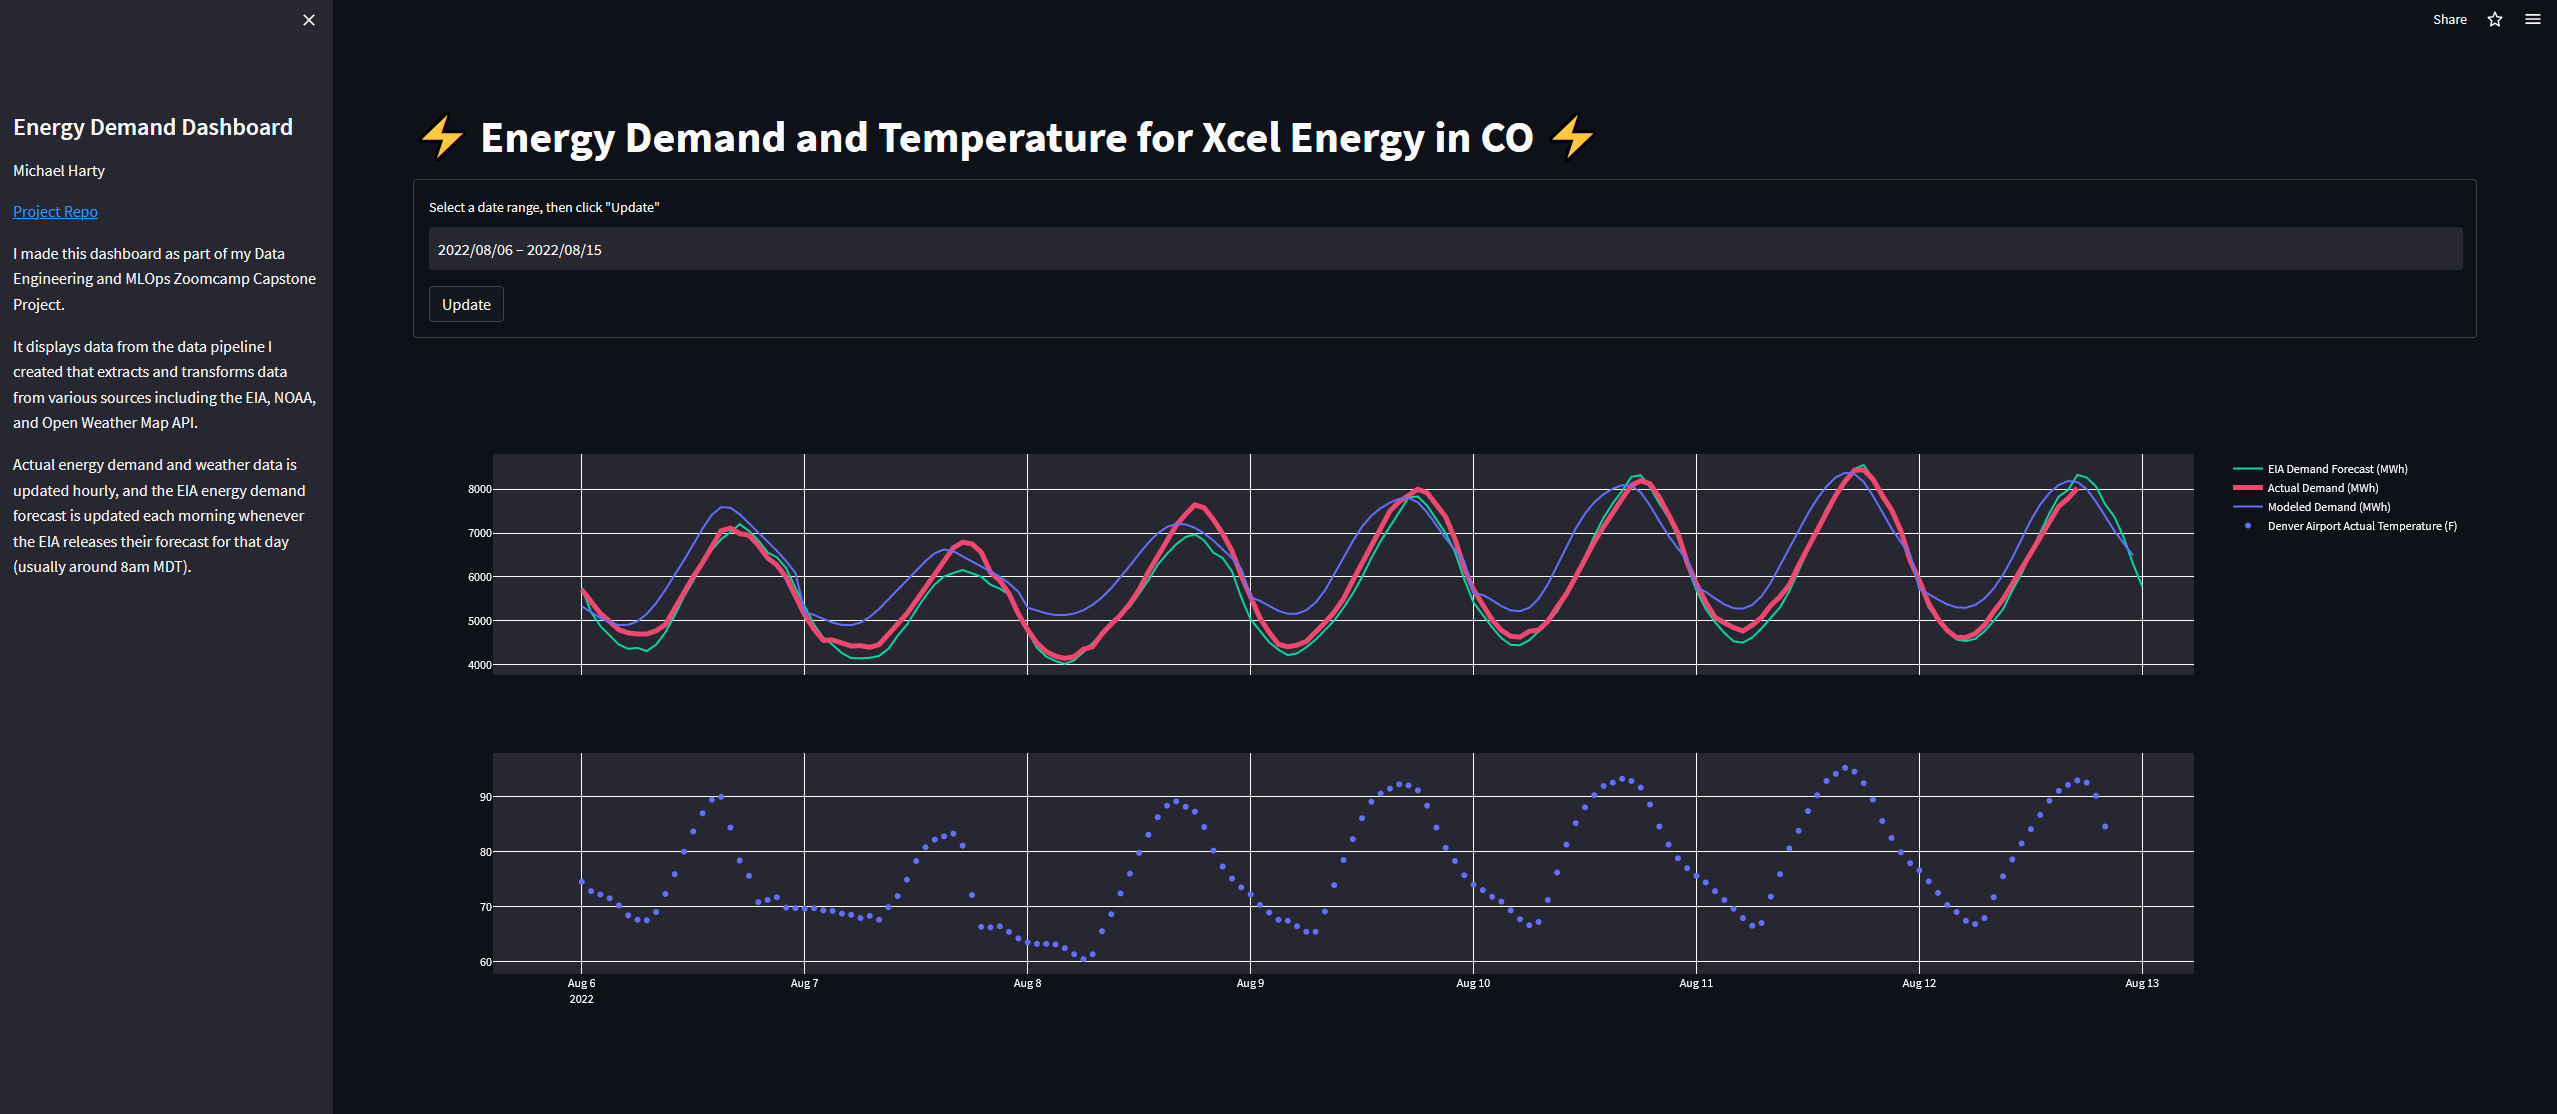
The data can be visualized on a dashboard built with Streamlit. The dashboard allows the user to select a date range and view the actual demand, the EIA’s forecast, and my model’s forecast (described below) along with weather data for the selected date range.
ML Ops
With a reliable data pipeline creating a clean dataset of historical electrical demand, I could begin to experiment with different machine learning models to predict electrical demand. The actual modeling was not the focus of the project, so I didn’t spend a lot of time on it. I tried a few different models and settled on a simple linear regression model with a little bit of feature engineering. The focus was more on how ML Ops tools can be used to create reliable system for modeling, deployment, and monitoring.
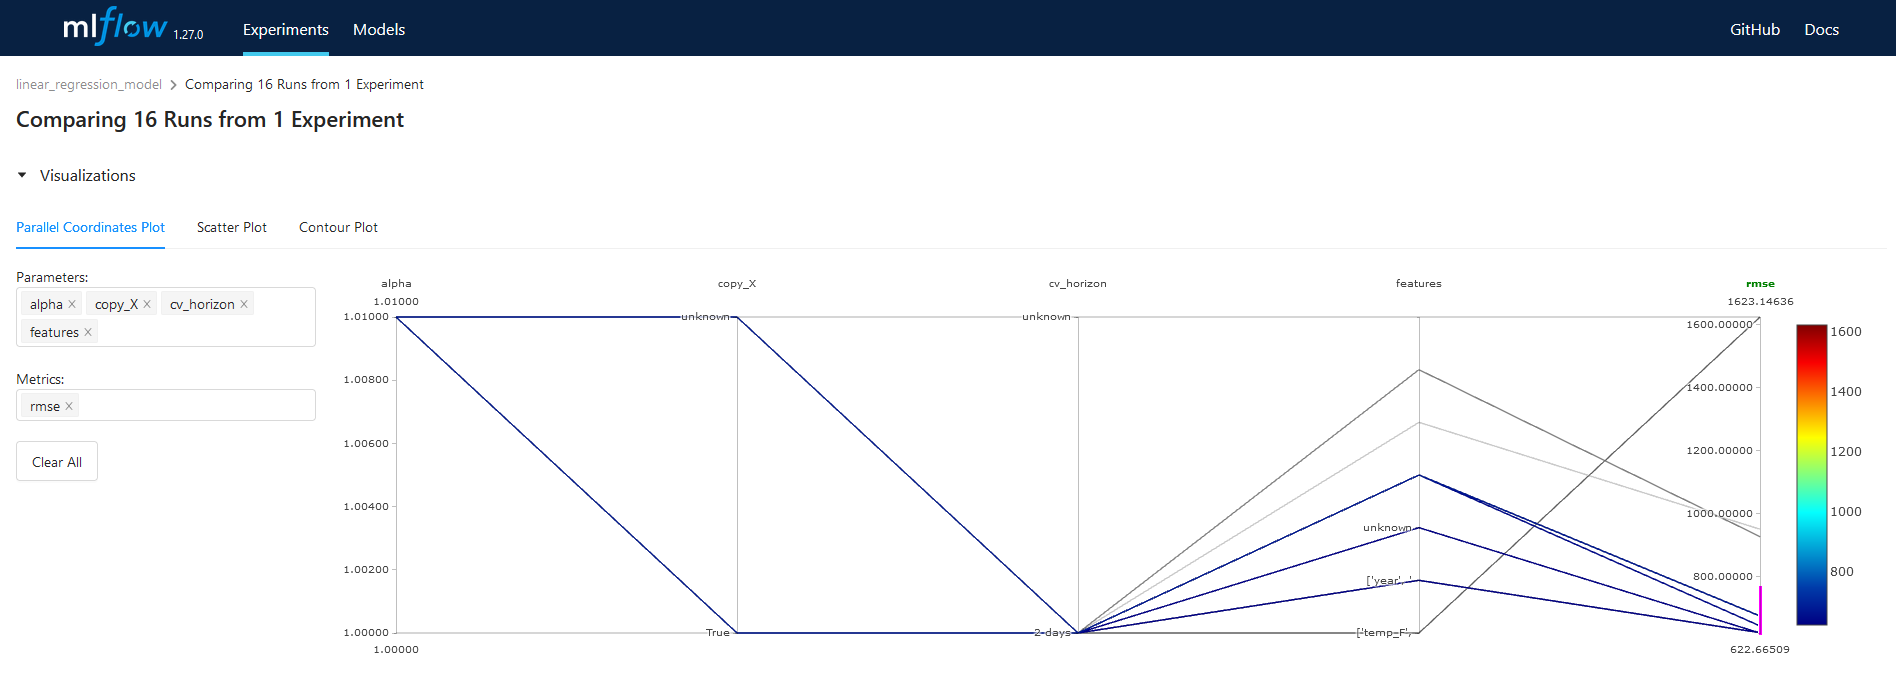
I used an MLFlow tracking server running on a Compute Engine VM to track my modeling experiments. The MLFlow UI has a lot of great features for comparing the metadata and performance metrics of different experiments. For example, the figure below shows a parallel coordinate plot of the performance metrics for different experiments.
When I was happy with a model, I registered it in the MLFlow model registry so it could be referenced by the deployment system in Airflow.
I deployed the model in batch using the same Airflow instance running the data preparation pipeline. Each night, Airflow runs the model and predicts the electrical demand for the next day. The predictions are stored in the data warehouse and visualized on the dashboard.
The performance of the model is tracked within the data warehouse using a dbt model. The model calculates performance metrics of the model on an hourly basis. The metrics are visualized on a dashboard built with Streamlit. The dashboard allows the user to select a date range and visualize the performance metrics for the selected date range.


Conclusion
The Data Talks Club Zoomcamps are a great way to learn practical data skills. Course work is great, but it’s so important to put skills to work in projects. This is how you learn the nuances of tools and how to combine them into a useful system.
I had a lot of fun learning these skills. It’s also been very rewarding to put them to direct use at work.
Comments